

| $10,000 ACCOUNT WITH 5% POSITION SIZES – EURUSD An Picture of what happens at a particular 355 pip profit Averaged per trade. (based on 100:1 margin) That doesn’t mean that every trade wins but some trades win big, ok a lot of trades win big… Check it out: |
With the percentage model vs. a strict contract position you get a correct form of compounding, correct for leveraged instruments such as Forex pairs.
Notice that in this model one would take all the trades. If one starts upon a few losing trades in a row the set back proves to not be difficult in past performance using 5% or less position sizes (unless you didn’t put in your stop loss.
You see you’ll want to trade a fractional percent each time.
This is REALLY how you do it.
| 18 Trades over 15 Months Averaged Profit Per Trade = 355 | ||||||||
| $10,000 Start | Account | 5% Re- | Next 5 | Account | 5% Re- | Account | 5% Re- | |
| 5 trades | Value | Evaluated | 10 trades | Value | Evaluated | 15 trades | Value | Evaluated |
| $8,875.00 | $18,875.00 | $943.75 | $15,975.00 | $34,850.00 | $1,742.50 | $30,175.00 | $65,025.00 | $3,251.25 |
| Per position | Per position | Per position | Per position | |||||
| Or .5 | Or .9 | Or 1.7 | 3.2 | |||||
| Contract | Contract | Contracts | Contracts | |||||
| OK Let’s add another pair How about the GBPJPY | ||||||||
| The current Averaged profit on GBPJPY is 457 Pips Profit for Every Single System Trade Placed | ||||||||
| $10,000 Start | Account | 5% Re- | Next 5 | Account | 5% Re | Account | 5% Re- | |
| 5 trades | Value | Evaluated | 10 trades | Value | Evaluated | 15 trades | Value | Evaluated |
| $11,425.00 | $21,425.00 | $1,071.25 | $22,850.00 | $44,275.00 | $2,213.75 | $45,700.00 | $89,975.00 | $4,498.75 |
| Per position | Per position | Per position | ||||||
| Or 1 | Or 2 | Or 4 | ||||||
| Contract | Contracts | Contracts | ||||||
| SUBTOTALS: | $155,000.00 | |||||||
| Profit In 15 Trades taking 5% risk position sizing Trading just two Forex Pairs So in this example we were trading Two Pairs at once ONLY! | ||||||||
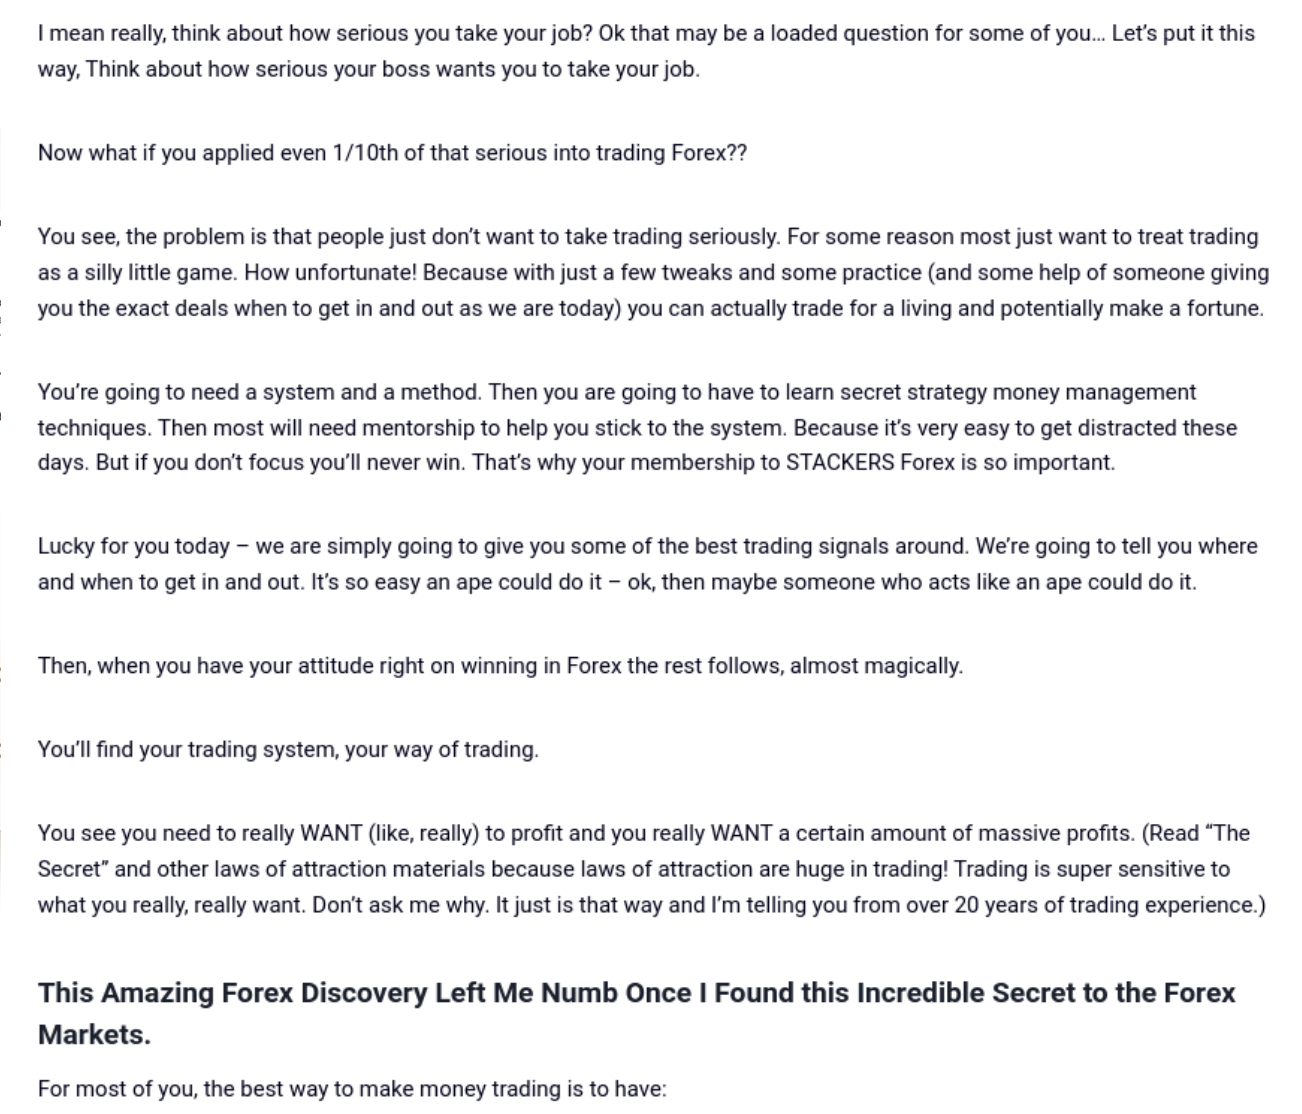
Performance
EURUSD = 300 Pips Averaged for Each Trade Placed!
GBPJPY = 365 Pips Averaged for Each Trade Placed!
GBPUSD = 418 Pips Averaged for Each Trade Placed!
USDCAD = 517 Pips Averaged for Each Trade Placed!
Those results were from 2009-2011 (and did not even include 2008 since 2008 was so amazing and profitable we did not include those results since did not want you to get overly excited). Market slowed Down in 2012 and 2013 although they picked up into 2014-2015 some. The Forex markets when you study back decades of price action cycle over and over between fast and slow markets. The trick is to not worry about it and simply take all the trades.
| Net Pipage | ||
| EURUSD | 12,007 | Pips |
| USDCAD | 9,301 | Pips |
| GBPJPY | 19,322 | Pips |
| GBPUSD | 16,307 | Pips |
| Subtotals | 56,938 | Pips Net Profit – Pocketable Profit and counting… |
| In Just Under 3 Years of Trading Systems Results 2008 January to December 2010 | ||
| Performance explained: STACKERS Forex is a Forex Net Worth building program. Trades can take up to 3 months or even longer. Sometimes they can cash out within 2 weeks or even a week. We aim to take out large RANGES – 1,000 pip ranges per trade (although sometimes we may only get 1/2 of that range depending on what the market gives us.) But the goal is 1000 pips for each trad! Different pairs perform better than others at different times although the GBPJPY can hit it’s target more easily when compared to the other pairs when the market is slower.If you are looking for a quick cash fix or if you simply need to win all the time due to sensitive emotional issues, this system, any service or any system is not for you. If you’re just doing trading for the thrills than maybe trading Forex is probably not for you. As strange as it may sound, if you look for more boring trading you’ll tend to be more profitable. The big money in Forex or other trading measurements is in the swing in and the medium-term trends. If you can expand your Time horizons more versus trying to make money every second you could potentially find a lot more profitability.That said we now have the STACKERSFX3.1 – CASHFLOWFX system to augment this system or more active cash flow.
This is a real trading system and we do not shy away from being one. We have learned much over the years and one thing we’ve learned is to not expect to win all the time and win immediately. We’ve also learned to develop trading systems that can last the test of time and net out and grow over time. We can only take what the markets give us and you can be assured that we all certainly want to be there when the market is giving – that’s why we develop trading systems – to take care of this. Obviously STACKERSFX Will be able to collect more pips in a faster market versus a slower market. But as you study currency pairs over time you’ll notice that there are cycling periods of fast price action versus slow-price action. And just when you think things are really boring the market takes often starts moving fast again so it’s best not to try and guess the fast versus slow times, It’s best just to take all the trades do not worry about it. For example in 2012 – 2013 the average profit per trade slowed to 197 pips per trade on the GBPJPY but then started picking up again in 2014. But you better be ready. The world is poised to be more volatile than ever and that often translates into the currencies. So the time to strike, get started with STACKERSFX is now! |
| GPBJPY | EURUSD | |||
| -283 | -165 | |||
| 921 | Aug-09 | 329 | ||
| 622 | 458 | |||
| -287 | 438 | |||
| 931 | -128 | |||
| 624 | -136 | |||
| 804 | 770 | May 17 2009 | ||
| -289 | 30 | |||
| 835 | 812 | |||
| -217 | -290 | |||
| 682 | 706 | |||
| 763 | 836 | |||
| 914 | 9-Apr | 722 | ||
| -497 | 593 | |||
| -49 | 860 | |||
| 897 | -295 | |||
| 486 | 718 | |||
| 801 | -123 | |||
| -451 | 967 | |||
| 701 | -261 | |||
| 711 | 1/5/2009 | -92 | ||
| 621 | -213 | |||
| 905 | -239 | |||
| 710 | 12-Nov | 899 | 1/1/08 | |
| -739 | 407 | 9/1/09 | ||
| 586 | 856 | |||
| 658 | -178 | |||
| 604 | 905 | |||
| 505 | 884 | |||
| 657 | 880 | |||
| -653 | -266 | |||
| -506 | 683 | |||
| -660 | -153 | |||
| 861 | -186 | |||
| 876 | 892 | |||
| -189 | -197 | |||
| -94 | -175 | |||
| 612 | -179 | |||
| 867 | -167 | |||
| 484 | 808 | 12/1/10 | ||
| -199 | Jan 1 2008 | 12007 | Pips Profit! | |
| 874 | Sep-09 | |||
| 625 | ||||
| -204 | ||||
| 942 | ||||
| 598 | ||||
| 801 | ||||
| 801 | ||||
| -263 | ||||
| -258 | ||||
| 725 | ||||
| 467 | ||||
| -312 | Dec-10 | |||
| 19322 | Pips Profit! | |||
| CADUSD | GBPUSD | |||
| 908 | 902 | 6/2/2009 | ||
| 917 | 5/1/09 | -187 | ||
| 741 | 723 | |||
| 575 | -346 | |||
| 877 | -217 | |||
| -359 | 580 | |||
| 915 | 828 | |||
| -280 | 718 | |||
| 629 | 969 | |||
| 942 | 528 | |||
| 623 | 590 | |||
| 834 | 521 | |||
| 839 | 725 | |||
| -158 | Jan 2008 Start | 836 | ||
| -186 | 9/1/09 | 825 | ||
| 907 | 846 | |||
| -211 | 926 | |||
| 787 | 12/1/10 | -87 | ||
| 9301 | Pips Profit! | -127 | 1/1/2009 | |
| -235 | ||||
| -254 | ||||
| 784 | ||||
| 935 | ||||
| 426 | ||||
| 913 | ||||
| 592 | ||||
| -157 | ||||
| -126 | ||||
| 946 | ||||
| -187 | Sep-09 | |||
| -233 | ||||
| -147 | ||||
| 906 | ||||
| 789 | ||||
| -213 | ||||
| 853 | ||||
| -166 | ||||
| -138 | ||||
| 1464 | Dec-10 | |||
| 16307 | Pips Profit! | |||